Eastern Washington Landslide Event Spring 2017 – Part 2
January 6, 2019
The spring of 2017 was in many ways a rare event for Eastern Washington. Yet, it provided us with crucial data that helps us to understand our landscape and gain a better understanding on when and where we might expect failures. One of the places that we do expect landslides is in burned areas. Wildland fires can create ideal conditions for landslides to occur. In a general sense, the removal of vegetation creates a scenario where water can easily concentrate on the landscape. Large storms, such as thunderstorms can overwhelm the ground, depending on the intensity of the burn and soil, the availability for the water to soak into the ground can be very limiting. The opposite can occur as well if the water can infiltrate into the ground, as the removal of vegetation can increase groundwater, as there is a drastic reduction of evapo-transpiration from trees and other vegetation. Sometimes we will see a combination of both of these within a fire area as well.
In 2015, Washington witnessed on of its most severe fire seasons, with large fire complexes burning across Central and Eastern Washington. Many of these fires were thousands of acres, with intense burning. Many areas experienced what is referred to as a stand replacement fire, which is when the fire burns with such intensity (often experiencing widespread crown/canopy fire), that a species of trees over a wide area is wiped out. If left to regrow naturally, a different species can become dominate within those areas.
One of the fire areas that experienced a significant number of landslides was the Carpenter Road Fire, which is between Springdale and Hunters. The fire burned approximately 63,972 acres, give or take a few acres and varied in intensity. However, a large portion of the area did experience high intensity crown fires, which caused a high mortality of tree survival within the area. It was one of the areas that was observed for instability and through the winter of 2015 to 2016, it seemed that it had remained relatively stable. However, in the spring of 2017, numerous landslides began to initiate throughout the fire area. See the map below.

In the field, most of these landslides occurred along road, commonly along road cuts. During the observations, it was apparent most of these areas had elevated groundwater that helped to initialize the movement of the landslide.

That makes sense, considering so much additional water was put into the system, as well as it was allowed to infiltrate into the ground through snow melt. There is more to the story. Lidar is relatively new for Eastern Washington, although there have been small pockets of it, overall coverage of the area has only been recent. When looking at the lidar for the Carpenter Road Fire Area, we can see that there are pockets of areas where deep-seated landslides exist. Additionally, areas where we observed landslides in the fire area correlate to a lot of these areas where deep-seated landslides are located. That makes sense, as deep-seated landslides are like the sponges of the landscape (generally, not always). In an event where higher levels of water is available in the landscape, deep-seated landslides potentially, have a higher chance of reactivating, or as we see in many areas in the Carpenter Road Fire Area, initiation of shallow landslides along the toes or areas where roads intercept the groundwater in the area.
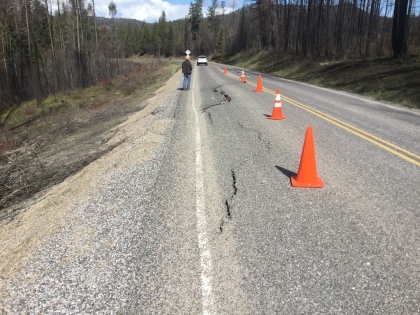
This is a good learning experience for fires, as the interaction with deep-seated landslides (and their reactivation) and/or initiation of shallow landslides within them can help us understand where we could expect instability in the future…
Eastern Washington Landslide Event Spring 2017 – Part 1
December 22, 2018
What happened in Eastern Washington in Spring of 2017?!? For those of you living out here, you understand that the higher than average snow with prolonged, higher than average rainfall in Spring caused widespread flooding, closing highways and causing many roads within NE region to become mud bogs instead of passable gravel roads. Yet, there is a story here and a greater appreciation to the dynamics of Eastern Washington, when it comes to landslides. This is a short presentation I did to summarize the event:

The Spring of 2017 in Eastern Washington was anything but normal. Snow came early to NE Region, but more than that, cold temperatures prior to the snow falling caused snow to fall onto frozen ground. There is an interesting dynamic out here when it comes to landslides, how the ground freezes can play a role in how landslides fail.
 Where to start. First, there was a concerted effort to document this landslide event. This wasn’t an easy task; as roads were failing around the area (there are a lot of gravel roads out here and as they became saturated, vehicles would break through the gravel road prism, potentially stranding the vehicle). The second difficulty, there was an enormous amount of erosion, so discerning landslides from erosion became a difficult process (pictures to follow to better explain this). This map (above) represents events that could be separated out from erosion events. The landslides were about even in separation on land-use, about half were in areas of managed timber lands, the other, were urban areas (roads, residential type areas).

For those who have spent any time in Eastern Washington, one of the most well known aspects of it, it is dry, much dryer than Western Washington. When we think of landslides and regional areas where we have landslides, this can make a big difference. In Western Washington, landslides typically fail when large storms come through (sometimes associated with lowland snow – or a rain on snow event, so I am thinking of December 1st to 3rd, 2007 or January 6th to 9th, 2009) or through long-term duration of rainfall (Westside winter of 2005-2006). In Eastern Washington, it is rare, except perhaps in summer thunderstorms, to have any one rainstorm event to trigger landslides. What perhaps makes sense, if not any one storm causes landslides, as there is just not enough precipitation to drive the antecedent moisture up high enough over time, we need to have long-duration, or concentrated water in others ways. So, the winter of 2016-2017, higher than average snow, followed by higher than average spring rains, brought about the equivalent of long-term duration of precipitation needed to trigger landslides.

This is a perfect chart to show just that, higher than average snow fall, followed by higher than average rainfall. Or, to really drive it home:

That wasn’t even the end of the event and for Eastern Washington, there was additional moisture after that as well. Yet, what made this interesting are these maps showing soil moisture:


We can see between the two maps, a progression of soil moisture migrating westward (in Eastern Washington). I never thought to review soil moisture maps for landslides (on the westside of Washington, we have a calculation for antecedent moisture and additional rainfall, so it was easier that way, but that same model doesn’t work well in Eastern Washington). When we look at these maps, we can see a correlation between landslides initiations and the progression and movement of soil moisture. What does that mean, here is what came out of the timing (as an observation):

It was touched upon earlier that frozen ground can play a role in landslide initiation. Coming from Western Washington, I had never thought about frozen ground playing much of a role in landslide initiation (it is rarely seen in that area), yet here in NE Washington, it can be common during spring thaw. Here is a simplified mechanic for how these landslides would occur. We have melting snow, which increases groundwater. As the groundwater starts to flow, it becomes impounded on a roadcut or sidecast that is frozen, resulting in increased pore-water pressure and eventually, causing the frozen material combined with the saturated material to fail and move. Here are some examples where we can see that:


Not a great picture I know, but we have a few more pictures of similar events, with similar scenarios:


In each of these events, the landslide material was identified as frozen blocks of material on top of a slurry of wet, flowing material.
This was the beginning of the event, but as we progressed, landslides became more ‘typical’ on how we think of them, increase groundwater causing increase pore water pressure, often perching on bedrock or some sort of substrate that water can perch onto.
More on that next time (and onto the burned areas in 2015).
Eastern Washington Landslides
December 22, 2018
*Brushing off some dust*
Welcome back! Okay, I know it has been a long time since I posted, that adventure is a story within itself. At this point, I am still working on landslides, but I have moved around a lot within that time and am now stationed in Eastern Washington and have been making my home and studying the area around here.
One of the things that I have been finding, news about landslides in Eastern Washington rarely reaches outside of the area and most people don’t realize that there are even landslides out here.


So, it seems about time that some pictures and data starts coming about with the landslides that occur out here. Above are landslides that came out in Spring of 2017, which was a major landslide event out here (more to follow on that).
Landslide near West Twin River
December 12, 2009
We received a tip yesterday that a landslide recently became active, probably in the storms that blew through the area in mid to late November. The landslide occurred in a quarry that has been inactive for some time. The highway south of the quarry is State Route 112.

The quarry is an old clay mine that use to supply clay to the cement mills in Seattle. It is actually still owned by a cement company that has a working plant in Seattle. The report we got was the landslide had rocks that were actively rolling town a scarp and some of the pictures we received are amazing.
 Photo by Dave Parks, Department of Natural Resources
 Photo by Dave Parks, Department of Natural Resources
The good thing, so far this landslide isn’t threatening any houses, pipelines, powerlines, or such. If it starts progressing uphill, it could eventually impact State Route 112, but at the moment it seems unlikely. The area of the site is part of the Miocene-Oligocene marine sediments of the Pysht formation of the upper Twin Rivers Group, which is locally interbedded carbonaceous and fossiliferous claystone, siltstone and some fine grained sandstone. A clay layer within the Pysht formation at the site was mined for cement manufacturing in Seattle. Also the Burke Museum has a whale skeleton (Miocene) from this quarry, probably by Jim Goedert. The Pysht formation also contains many near shore fossils, like bivalves and gastropods. So, we will keep our eyes out for another whale skeleton (although we might need a bigger truck). Before you think this would be a great place to head out, know that this area is extremely dangerous. Rocks are currently raveling down the scarps and toe of this landslide and sections of the landslide can move and give way at any moment. It isn’t worth your life to try and collect fossils here. The ground is torn apart and you could easily fall into a covered (or uncovered) crevasse and get trapped. Sudden movement of the landslide or the snapping of tree roots could knock over trees without warning. This area is also private property and no tolerance will be given to anyone caught in this area, especially given the extreme danger that this area faces. If you would like to collect fossils from the Pysht Formation (or anywhere like that), contact the DNR Geology and Earth Resources Division, they can help you find safe and legal locations to collect on.
Nile Landslide LiDAR
December 10, 2009
Sometimes you get a Christmas gift you weren’t expected. I guess in this case, it was more of a birthday gift. LiDAR for the Nile Landslide has finally preliminarily been released to various people to help in analysis on the landslide, but has not yet been released to the general public until the proper QA/QC has been established on the data. If you are working on the Nile Landslide (and I have talked with many of you already) and would like a copy of the LiDAR, contact me and I’ll see what we can arrange.
That being said…

I am going to analyze the lidar a bit more, but some interesting things. You can clearly see some of the uplifted areas, although it might not be as extensive as we previously thought. There are a few secondary landslides within the landslide mass, one major one by the quarry. Near the center of the landslide, there are some odd peaks (near the toe), not sure what those are, but I’ll try and find out today. Anyway, stay tuned, this is a key piece of data to help us understand the Nile Landslide. The Lidar also covers the Sanford Pasture Landslide as well and this will give us clues to the activity and morphology of this landslide as well.
Landslide Wrap Up for November, Threshold Modelling
December 2, 2009
Well, we almost got through Thanksgiving without a landslide. There was another landslide on Chuckanut Drive near Spokane Street. The first time I saw reported was 11:45am on 11/26/2009. That makes 11 reported landslides so far.
These little storms that roll through are really a wealth of information. Since we are embarking on trying to make a landslide forecasting system, we need to figure out the precipitation thresholds. The nice thing is, these small landslides are probably failing just at the border of that threshold. The problem is figuring out the precipitation variables. As far as I can figure, it doesn’t look like the USGS Seattle Landslide threshold model is holding up in the rest of the state (nor should we expect it to).

So, I threw together the precipitation data for a 3-day, 15-day USGS threshold models. We are assuming that the areas are probably at or very close to antecedent moisture threshold values. As you can see in the map, almost all of western Washington was above the threshold and guess what, we did have landslides. However, the amount of false positive that this map portrays is fairly concerning, unless there are a ton of landslides we haven’t seen. I guess the model is fairly simple in that it just says there is a likely chance that landslides could occur past the threshold. I think we might be able to improve upon this, maybe we can come up with a threshold model and as we pass the threshold, we can come up with a estimates landslides per acre, or something relevant that we could better plan or manage for an impending disaster. The biggest hurdle I am facing right now is, what sort of day ratio is the correct one. I don’t think the 3 day-15 day is going to work, or if it is, we need to drastically change the threshold value for various parts of Washington. Second, do we have indicator areas when the thresholds are starting to get reached, say, Chuckanut Drive or Eagle Cliffs down on SR 4. I have a dozen other questions, both those are foremost on my mind today.
More Storms and a Potential for Landslides
November 19, 2009
Two bigs storms are hitting Washington State, one blowing in last night, another blowing in this afternoon. So far, no landslides have been reported over major roadways or have made it into the media (although where we had rainfall so far isn’t well covered by the media). However, this last storm added water into already soaked hillsides, setting up the stage for the potential for sliding this evening and into tomorrow.
We don’t have a forecasting system up yet (so far I have been swamped by other projects and haven’t been able to spend enough time getting it going). But, we can try and make some estimation of areas that will have a higher chance of sliding. I would put this akin to a back of the napkin calculation.

Landslide Risk Map Nov 19-20
This is our forecasted rainfall for the next day or so (including some of the precipitation from yesterday). The things to note in all of this, much of the higher elevations where higher rainfall is shown is mostly snow, I never parsed that out in the file. Next, I just used forecasted inches of rainfall to determine where the difference between low and high should be. It is a little arbitrary, but I did look back at the other smaller storms with somewhat similar soil saturations to help determine when we started seeing landslides initiating. This is more of an experiment at this time to see if we can make a really simplified forecasting system that tries and predicts which counties will be at risk of landslides during a storm. A note of caution, even in the low areas we can expect landslides, especially in urban areas. In less urban areas, water usually knows where it wants to go, has been going there for a long time. In urban areas, we have a lot more control over that water, we channel it on roadways and usually discharge it into sewers or into creeks. The problem, if a road channeling water is blocked (either by leaves, debris or some other thing), that water can be diverted, saturating a nearby hillside and causing a landslide, even though rainfall was low. This can also occur with property owners concentrating water on their property. There are a lot of other factors involved of course, but you get the idea.
